ICFP FAQ
Loading...
The Risk of “Safe Assets” is that you might end up running in place
How many millionaires do you know that have become wealthy by investing in savings accounts?
I rest my case.
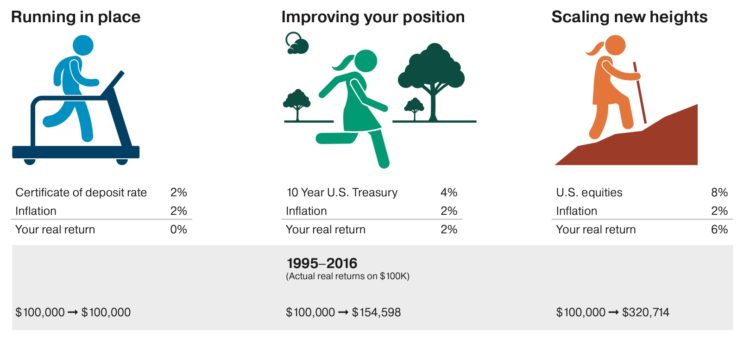
Sources:Bankrate.com, U.S. Treasury, and Standard & Poor’s. Rates of return and inflation are derived using the averages from 1995 to 2016. U.S. equities are represented by the S&P 500 Index. Past performance does not guarantee future results.
If you are enrolled in a high-deductible plan, you can contribute to an HSA.
Investing your HSA contributions for the long term and paying for current health care expenses out of income or short-term savings can provide significant tax-free funds for health care expenses in retirement.
Accounts for Individual(s)
Accounts for Employer(s)
Work with us to better understand how these types of accounts fit into your financial plan.
Tax deferral means that the payment of taxes is delayed.
Income allocation is what sources of income are reflected on each year’s tax returns. These sources are different based upon your set of circumstances, but could be, but not limited to, Wages, Pensions, Social Security Benefits, Retirement Plan distributions, Taxable Savings, Dividends, Capital Gains, distributions from properties or companies; the list goes on.
By planning what distributions come from what sources, it may help mitigate your annual income tax burden, as well as, help give you perspective on where the sources of your income will be coming from for years to come.
Only after we have a firm understanding of your needs and goals, compensation for our services can take on one of these four forms:
Each implementation strategy has its benefits and its draw backs. The key catalyst for making a decision is based on your situation.
Diversifying advisors may provide you insight to the different levels of service other investment professionals provide. However, this perceived diversification may result in inadequate financial planning due to a lack of knowledge of holdings elsewhere, as well, as potentially unsuitable investment allocations due to the lack of knowledge of material changes to your account(s) with other institutions. The investor also may be able to save on overall investment related expenses by consolidating accounts and taking advantage of relative economies of scale.
Some engagements listed below, not limited to:
A broker/dealer is a company that a registered investment professional is required to affiliate with in order to buy or sell investment products on behalf of investors. The broker/dealer holds responsibility for regulatory compliance and adherence to securities laws. The Securities and Exchange Commission (SEC) delegates the supervision of financial advisors to the Financial Industry Regulatory Authority (FINRA).
An independent financial professional is not an employee of an investment or financial services firm – they are an independent business owner. They have the freedom to structure their business in a manner that best serves their clients. The independent financial professional utilizes the services of the broker/dealer to process investment business, provide services such as practice management and education.
Being independent means we are not forced to sell proprietary products or meet sales quotas. Therefore, we are not pressured or distracted by corporate interests and can focus on what is best for you and your financial goals.
You may be familiar with broker-dealers that are subsidiaries of conglomerates such as commercial banks, investment banks, and investment companies. An independent broker-dealer is different from such firms because they generally do not underwrite securities, they do not create research, and they do not engage in investment banking.
Now, more than ever, a client wants ‘‘peace of mind’’ when it comes to the safety of financial assets.
A registered representative is an independent business owner who provides financial guidance to their clients and is typically paid a commission when you purchase a financial product.
An Investment Advisor Representative (IAR) is an independent business owner who provides financial guidance to their clients and is generally paid a fee for either managing assets, giving advice or both.
A broker-dealer processes the commission business of registered representatives licensed with the firm and holds responsibility for regulatory compliance and adherence to securities laws.
A Registered Investment Adviser (RIA) processes the fee-based business of IARs licensed with the firm and holds responsibility for regulatory compliance and adherence to securities laws.
Pershing LLC, National Financial Services, LLC, and select firms provide the trade execution, clearing, custody, and other services for securities and related transactions.
Mutual funds, managed accounts, stocks, bonds, etc.

As part of our ongoing commitment to our clients, we continually seek knowledge in our industry to be best prepared to address the needs of our clients.
The Risk of “Safe Assets” is that you might end up running in place
How many millionaires do you know that have become wealthy by investing in savings accounts?
I rest my case.
Sources:Bankrate.com, U.S. Treasury, and Standard & Poor’s. Rates of return and inflation are derived using the averages from 1995 to 2016. U.S. equities are represented by the S&P 500 Index. Past performance does not guarantee future results.
Sometimes investment firms create and use identical portfolios for their clients regardless of whether the account is a taxable account or tax deferred account.
Your income allocation is comprised of the components of your taxable income you can control.
Every client wants to get the most out of their investments. They want the highest possible returns with the least amount of risk.
Improve your chances for more consistent returns over time.
Reduce overall risk.
Stay focused on your objectives
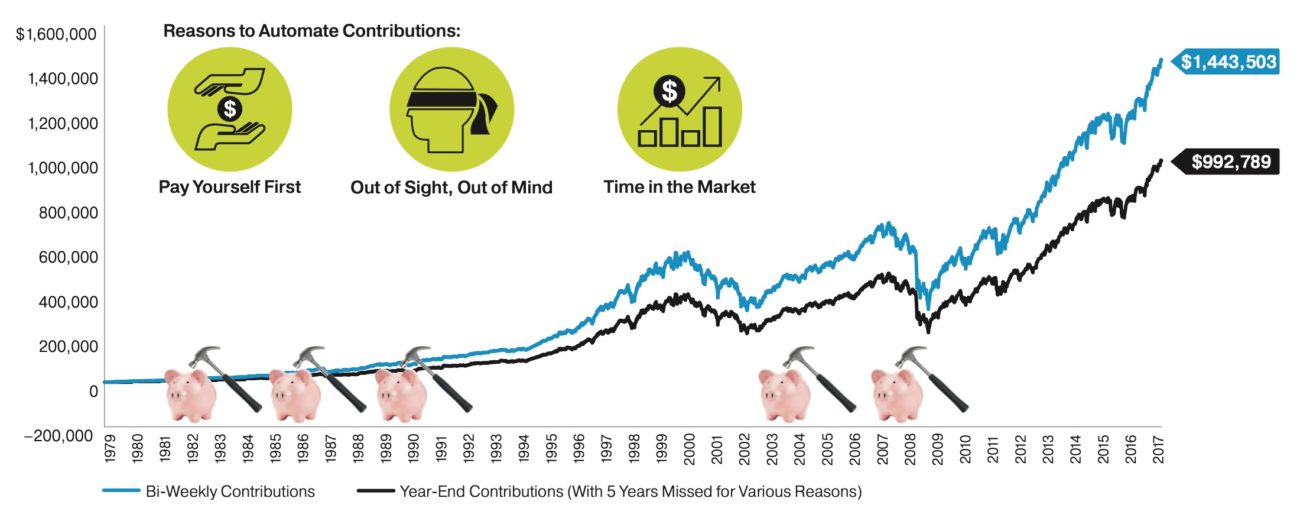
Participating in your employer’s plan helps to automate your retirement savings through a “savings habit.”
How many millionaires do you know that have become wealthy by investing in savings accounts? I rest my case.
Sources:Bankrate.com, U.S. Treasury, and Standard & Poor’s. Rates of return and inflation are derived using the averages from 1995 to 2016. U.S. equities are represented by the S&P 500 Index. Past performance does not guarantee future results.
Individuals who opt not to engage a professional to assist them with their particular needs often share several distinct characteristics. These traits enable them to successfully manage their tasks without external support.
Time: These individuals possess sufficient time to dedicate to their respective tasks. Their schedules allow them to invest the necessary hours to complete what is required.
Aptitude: They have the specific skills and expertise needed to accomplish their desired objectives. Their unique abilities make them well-suited to handle the job on their own.
Desire: They genuinely enjoy spending their time working on these tasks. The process itself offers them a sense of satisfaction and fulfillment.
If, at any point, one of these three elements—time, aptitude, or desire—is no longer present in their lives, these individuals are likely to seek help and delegate responsibilities to a financial advisor.
By delegating to a professional, they gain the freedom to spend their time in other ways that they find more meaningful or enjoyable.
Why Financial Planning Matters: Engaging in a financial planning process offers several key benefits that can help individuals and families work toward their financial goals and improve their overall financial well-being.
Personalized Guidance and Direction: The process of financial planning provides personalized advice and direction. This tailored approach is designed to help you achieve a better financial position by addressing your specific needs, goals, and circumstances. Having a clear plan allows you to make informed choices that support your financial objectives.
Adapting to Changing Circumstances: The world is constantly evolving, and so are your personal circumstances. A well-structured financial plan helps you navigate these changes, enabling you to make better financial decisions as your life and the broader economic environment shift. This adaptability is crucial for maintaining financial stability and reaching long-term goals.
The Importance of Behavior in Financial Planning: Financial planning is not just about managing money; it is fundamentally about managing behavior. Successful financial outcomes often depend more on your habits and decisions than on financial products or market performance. Staying disciplined and following your plan can make a significant difference in your financial journey.
“No airplane can take off without a flight plan; no ship can set sail without a plotted course.” ~ Nick Murray.
A fiduciary is an individual who is entrusted with the responsibility to act in the best interests of another party. This role requires a high standard of care and loyalty, as fiduciaries are expected to manage assets, make decisions, or provide services with integrity and good judgment.
Individuals acting in a fiduciary capacity are expected to provide services according to five basic principles of fiduciary duty:
We invite you to experience a fiduciary relationship where your interests, goals, and objectives come first.
Making the most of a Roth IRA requires evaluating your financial situation and tax strategy at each stage of life. By considering your current tax position, future income, and retirement goals, you can maximize the benefits of Roth accounts. Below are key strategies for opportunistic evaluation and management of a Roth IRA.
As you approach retirement, there are several important factors to evaluate and decisions to make. The following topics outline the essential considerations for planning a successful and secure retirement:
As you approach retirement or consider changing jobs, understanding your retirement plan options is crucial to your financial future.
There are typically four options to consider when leaving an employer’s retirement plan, each with its benefits and considerations:
Each option has its advantages and disadvantages, but the decision should fit into your overall financial plan. For more information, see Financial Planning.
Welcoming a new baby is an exciting and transformative time, but it also comes with important financial considerations. Planning ahead can ease the transition and help ensure your family’s financial security.
“Every night before I get my one hour of sleep, I have the same thought: ‘Well, that’s a wrap on another day of acting like I know what I’m doing.’ Most of the time I feel entirely unqualified to be a parent. I call these times being awake.”—Jim Gaffigan
“In my house I’m the boss, my wife is just the decision maker.”


“There’s no place like home.” —Dorothy Gale
Financial science has taught us that the market is an effective information-processing machine. Each day, the world equity markets process billions of dollars in trades between buyers and sellers; and the real-time information they bring helps set prices.

In USD. Source: Dimensional, using data from Bloomberg LP. Includes primary and secondary exchange trading volume globally for equities. Funds are excluded. Daily averages were computed by calculating the trading volume of each stock daily as the closing price multiplied by shares traded that day. All such trading volume is summed up and divided by 252 as an approximate number of annual trading days.
The market’s pricing power works against stock pickers and market timers: Only 17% of US-domiciled funds beat their benchmarks over the past 20 years. In contrast, by using information in prices, 84% of Dimensional funds have beaten their benchmarks in that time.
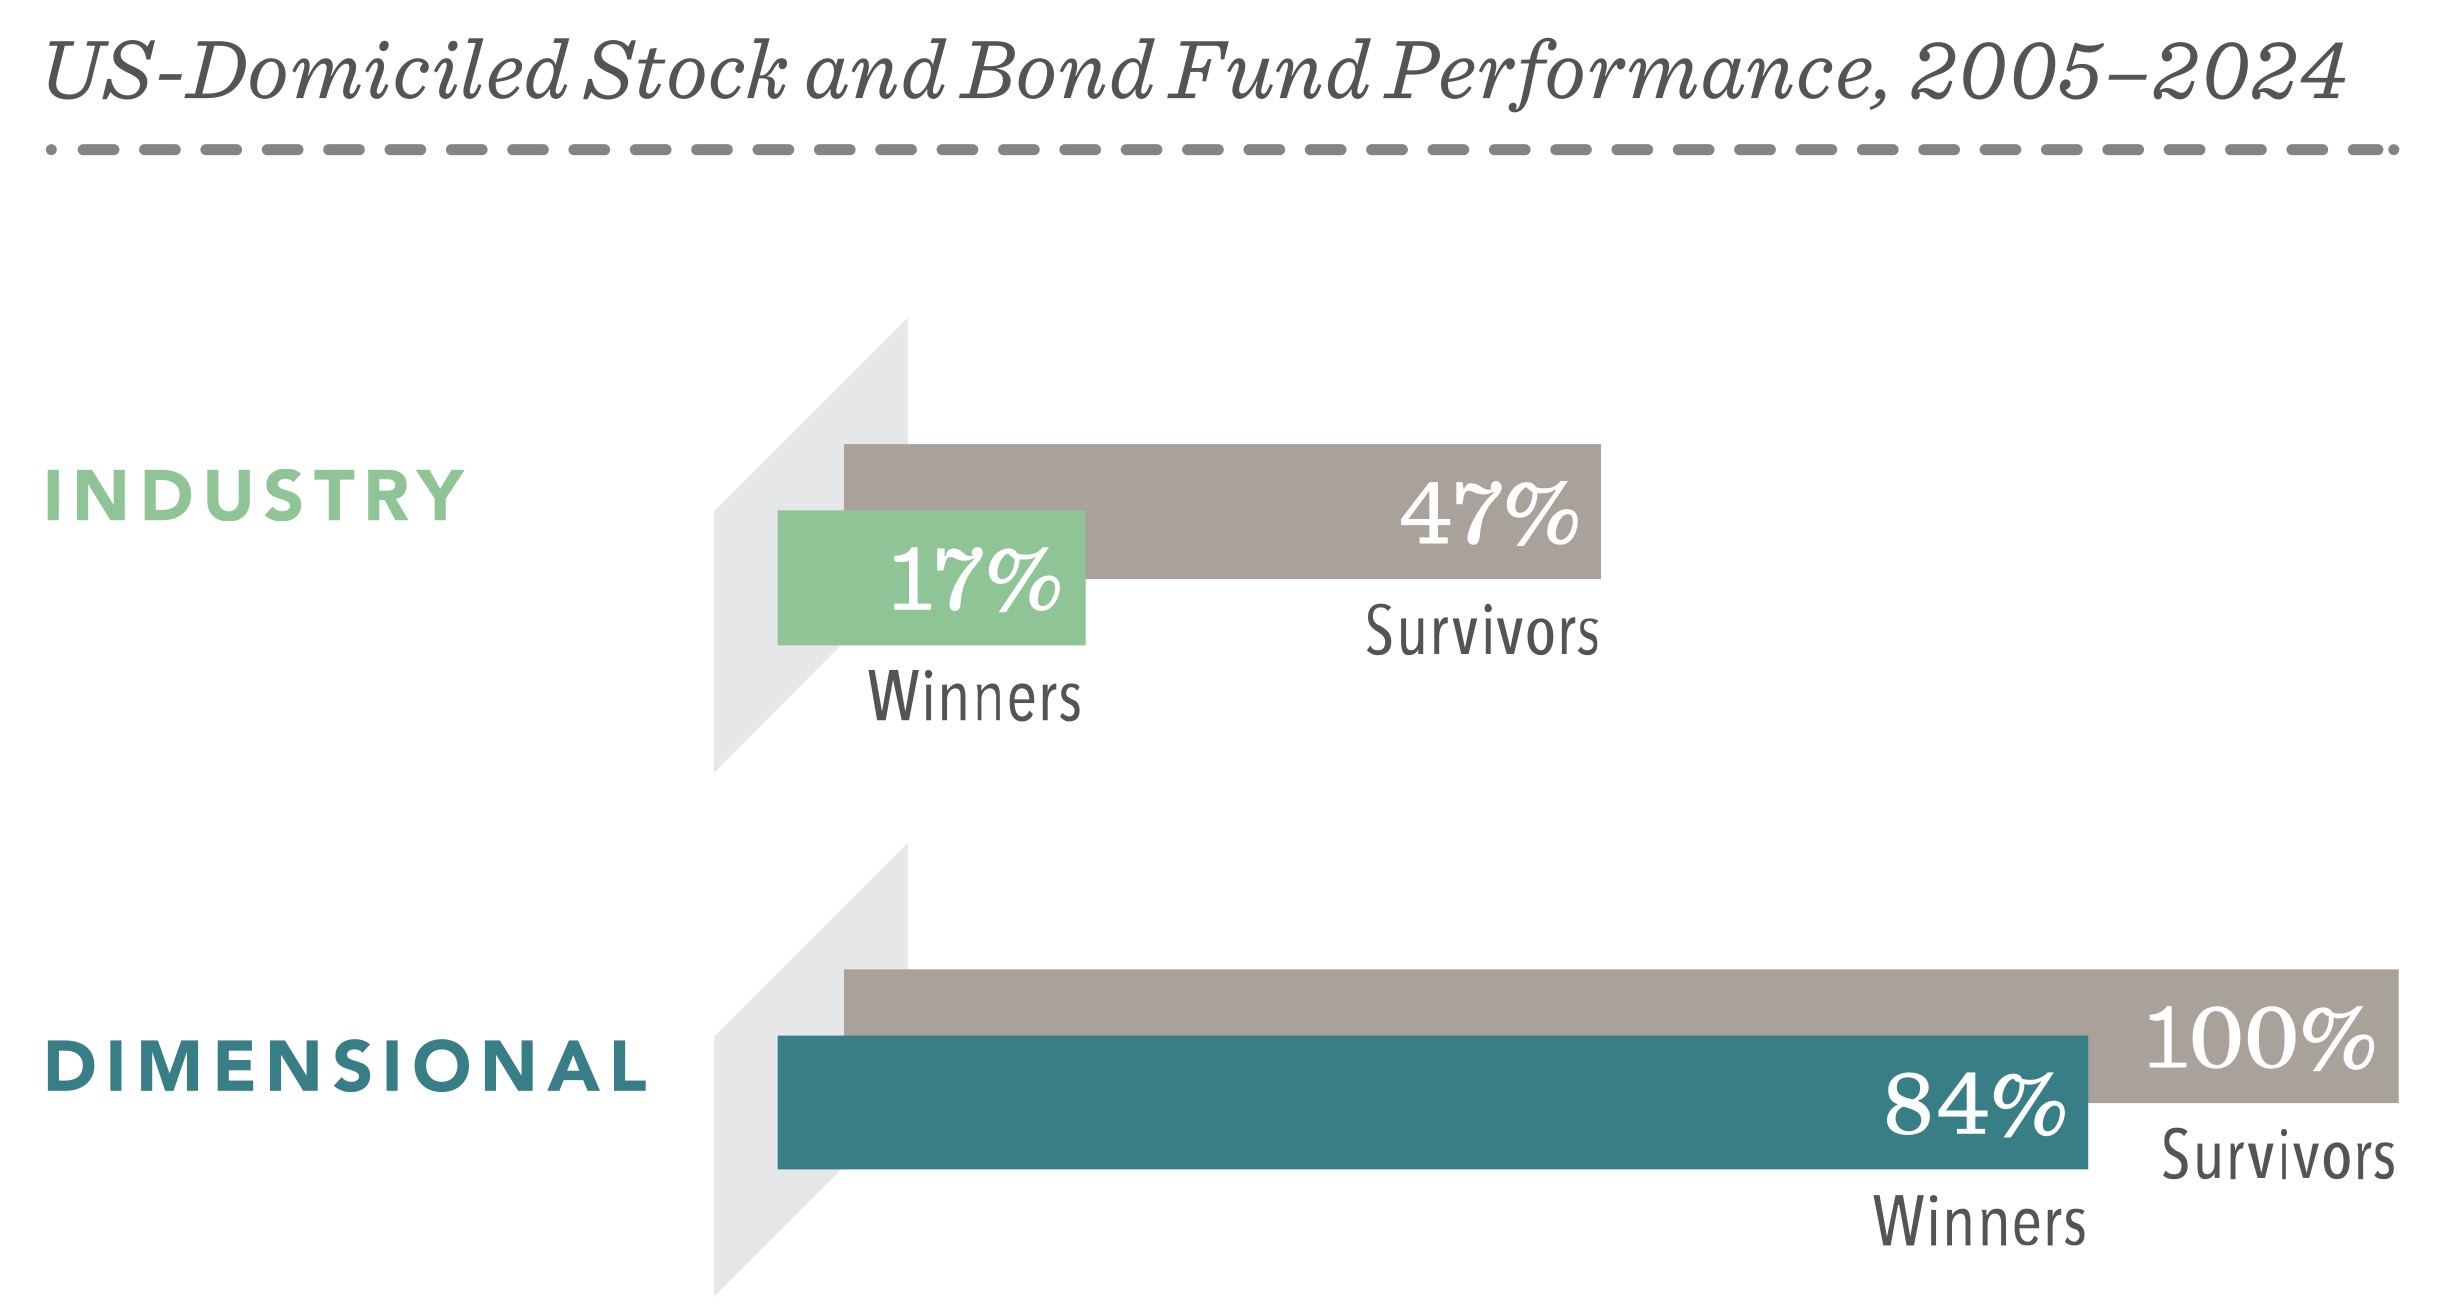
The sample includes funds at the beginning of the 20-year period ending December 31, 2024. Each fund is evaluated relative to its primary prospectus benchmark. Survivors are funds that had returns for every month in the sample period. Winners are funds that survived and outperformed their benchmark over the period. Where the full senes of primary prospectus benchmark returns is unavailable, non-Dimensional funds are instead evaluated relative to their Morningstar category index Data Sample: The sample includes US-domiciled, USD-denominated open-end and exchange-traded funds (ETFs) in the following Morningstar categories. Non-Dimensional fund data is provided by Morningstar. Dimensional fund data is provided by the fund accountant. Dimensional funds or subadvised funds whose access is or previously was limited to certain investors are excluded. Index funds, load-waived funds, and funds of funds are excluded from the industry sample Morningstar Categories (Equity): Equity fund sample includes the following Morningstar historical categories: Diversified Emerging Markets, Europe Stock, Foreign Large Blend, Foreign Large Growth, Foreign Large Value, Foreign Small/Mid Blend, Foreign Small/Mid Growth, Foreign Small/Mid Value, Global Real Estate, Japan Stock, Large Blend, Large Growth, Large Value, Mid-Cap Blend, Mid-Cap Growth, Mid-Cap Value, Miscellaneous Region, Pacific/Asia ex-Japan Stock, Real Estate, Small Blend, Small Growth, Small Value, Global Large-Stock Blend, Global Large-Stock Growth, Global Large-Stock Value, and Global Small/ Mid Stock. Morningstar Categories (Fixed Income): Fixed income fund sample includes the following Morningstar historical categories: Corporate Bond, High Yield Bond. Inflation-Protected Bond, Intermediate Core Bond, Intermediate Core-Plus Bond, Intermediate Government, Long Government, Muni California Intermediate, Muni Califomia Long, Muni Massachusetts, Muni Minnesota, Muni National Intermediate, Muni National Long, Muni National Short, Muni New Jersey, Muni New York Intermediate, Muni New York Long, Muni Ohio, Muni Pennsylvania, Muni Single State Intermediate, Muni Single State Long, Muni Single State Short, Muni Target Maturity, Short Government Short-Term Bond, Ultrashort Bond, Global Bond, and Global Bond-USD Hedged.
Index Data Sources: Index data provided by Bloomberg, MSCI, Russell, FTSE Fixed Income LLC, and S&P Dow Jones Indices LLC. Indices are not available for direct investment. Their performance does not reflect the expenses associated with management of an actual portfolio. US-domiciled mutual funds and US-domiciled ETFs are not generally available for distribution outside the US.
Some investors make choices based on past returns. Yet past performance offers little insight into future returns. For example, stocks that have grown to be among the 10 biggest in the US have tended to lag the overall market after reaching that size, failing to maintain their strong performance.

In USD. Source: Dimensional, using data from CRSP Includes all US common stocks excluding REITs. Largest stocks identified at the end of each calendar year by sorting eligible US stocks on market capitalization. Ten largest companies by market capitalization. Returns after joining the 10 largest are measured as of the start of the first calendar year after a stock joins the lop 10. Annualized excess retum is the difference in annualized compound returns between the stock and the S&P 500 Index over the three-, five-, and 10-year periods, before and after each stock’s initial year-end classification in the Top 10. Three-, five-, and 10-year annualized returns are computed for companies with retum data available for the entire three-, five-, and 10-year periods, respectively The number of firms included in measuring excess returns prior (subsequent) to becoming a Top 10 stock consists of 44 (58) for the three-year period, 43 (55) for the five-year period, and 34 (49) for the 10-year period.
The financial markets have rewarded long-term investors. People expect a positive return on the capital they supply, and the stock and bond markets have provided growth of wealth that has more than offset inflation, as this chart of the past 50 years shows.
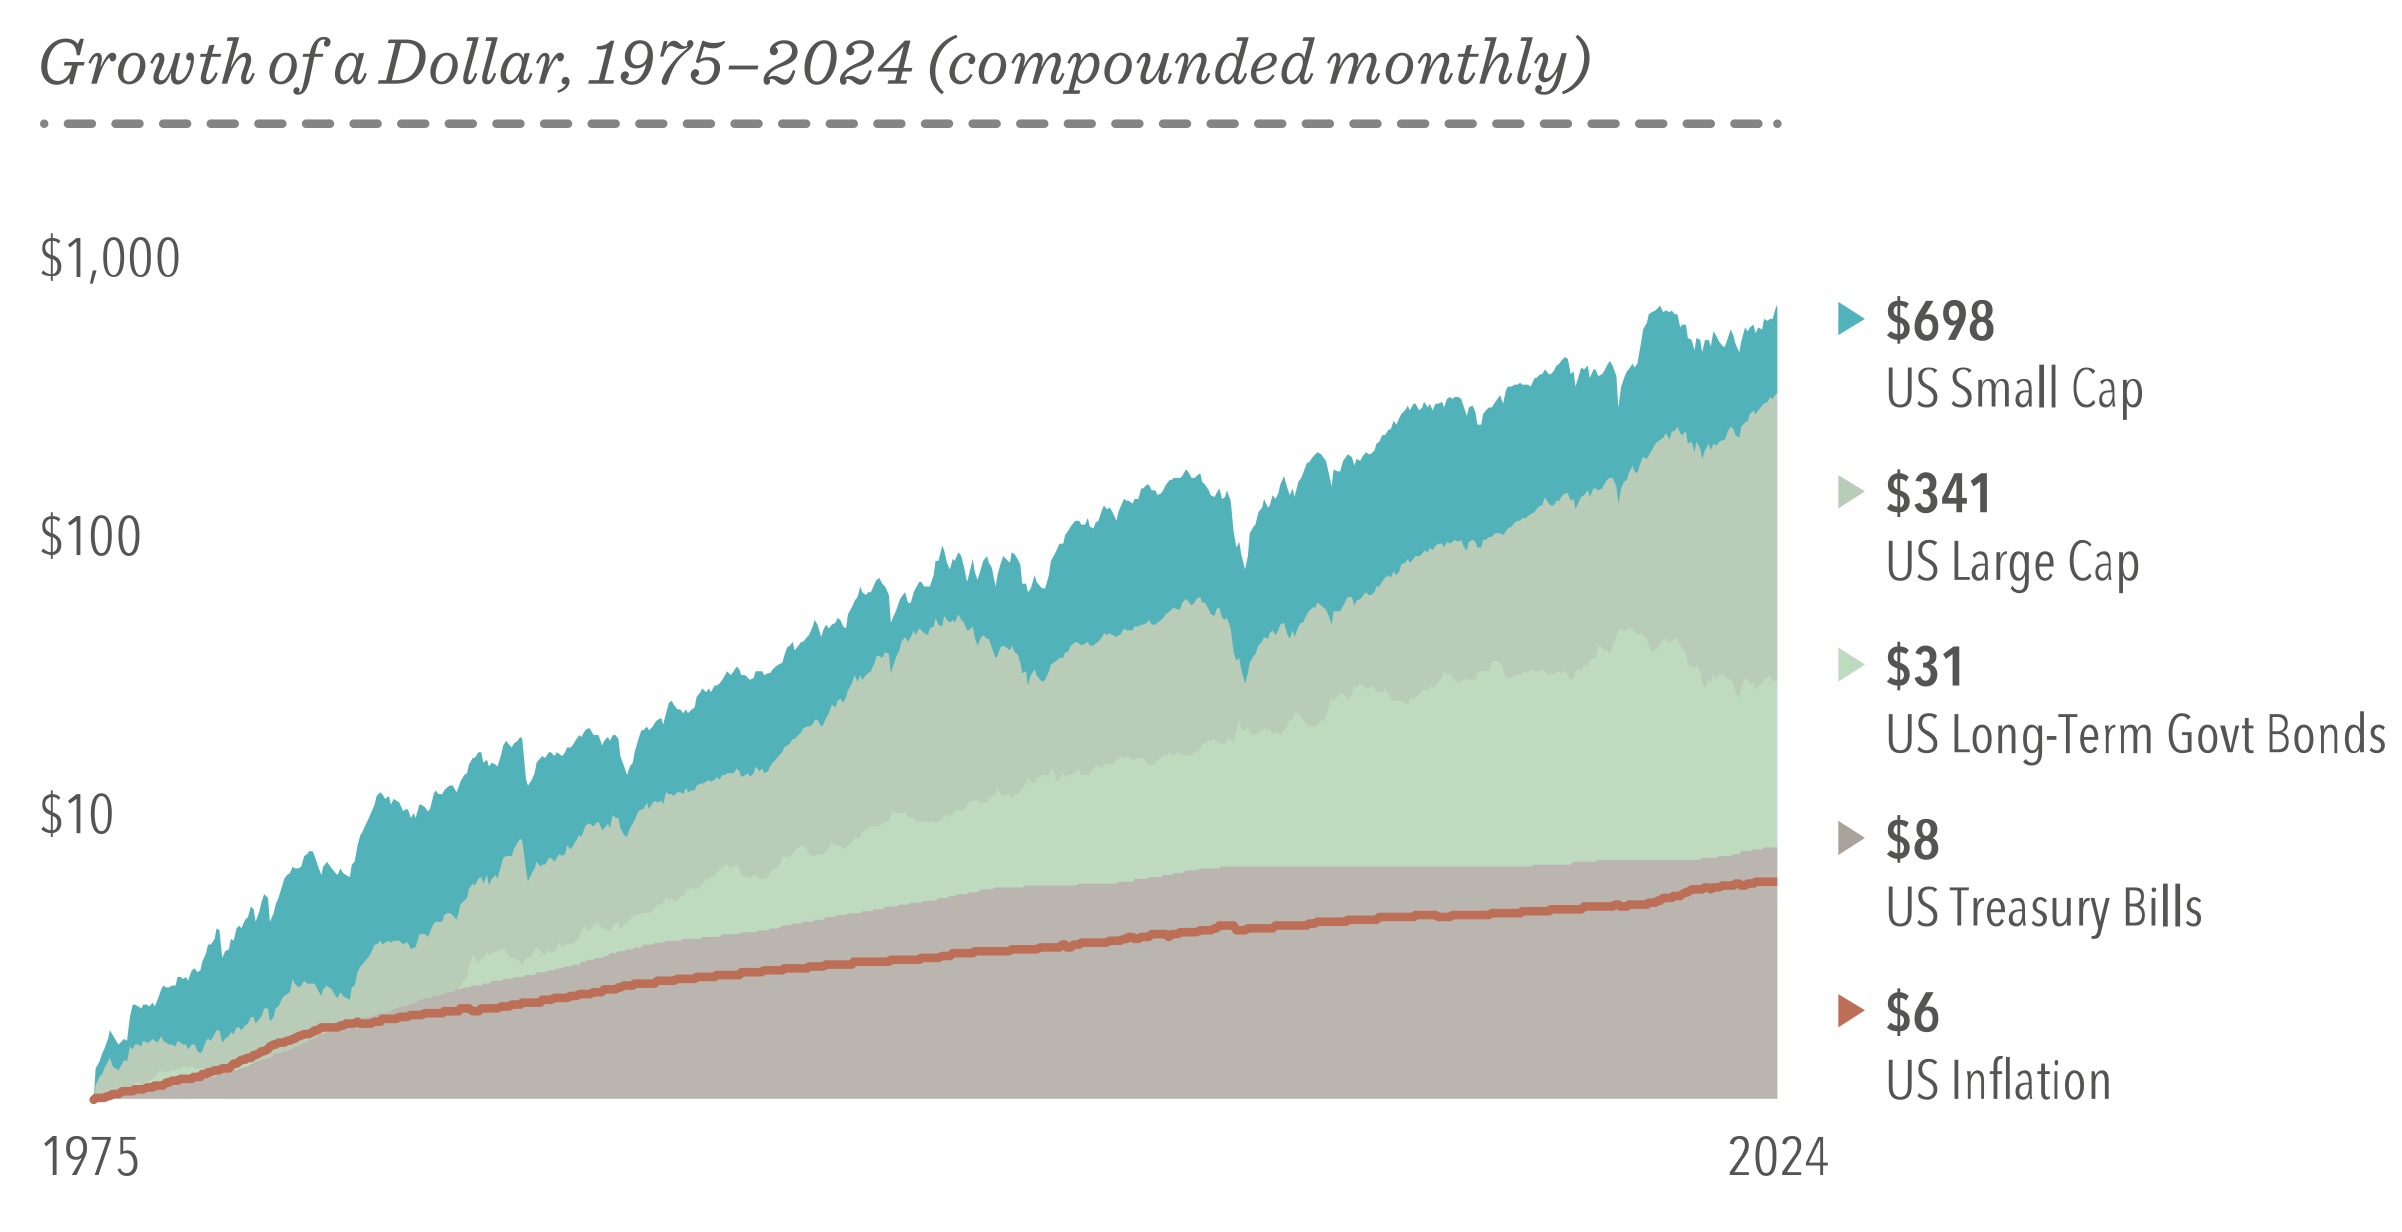
In USD. US Small Cap is the CRSP 6-10 Index. US Large Cap is the S&P 500 Index. US Long-Term Govt Bonds is the Bloomberg US Government Bond Index Long. US Treasury Bills is the IA SBBI US 30 Day TBill TR USD. US Inflation is measured as changes in the US Consumer Price Index. Data presented in the Growth of a Dollar chart is hypothetical and assumes reinvestment of income and no transaction costs or taxes. The chart is for illustrative purposes only and is not indicative of any investment.
Academic research into decades of stock and bond returns has identified long-term drivers of outperformance. By investing systematically in the areas with higher expected returns, you can aim to beat the market.
Small companies outperform large companies over time
Value stocks outperform growth stocks over time
Companies with high profitability outperform those with low profitability over time
Wider term spreads generally lead to higher term premiums
Wider credit spreads generally lead to higher credit premiums
Global currencies of issuance offer opportunities for higher expected returns and reduced volatility
Relative price is measured by the price-to-book ratio; value stocks are those with lower price-to-book ratios, Profitability is measured as operating income before depreciation and amortization minus interest expense scaled by book.
Holding a globally diversified portfolio can broaden your opportunities beyond your home market; putting you in a better position to capture higher returns wherever they appear.

Number of holdings and countries for the S&P 500 Index and MSCI ACWI IMI (All Country World IMI Index) as of December 31, 2024. International investing involves special risks, such as currency fluctuation and political instability. Investing in emerging markets may accentuate these risks.
Research has shown there’s no reliable way to time the market; targeting the best days to be invested or moving to the sidelines to avoid the worst days. It has also shown the impact of being out of the market even for a short time. Staying invested helps ensure you’re in position to capture long-term gains.
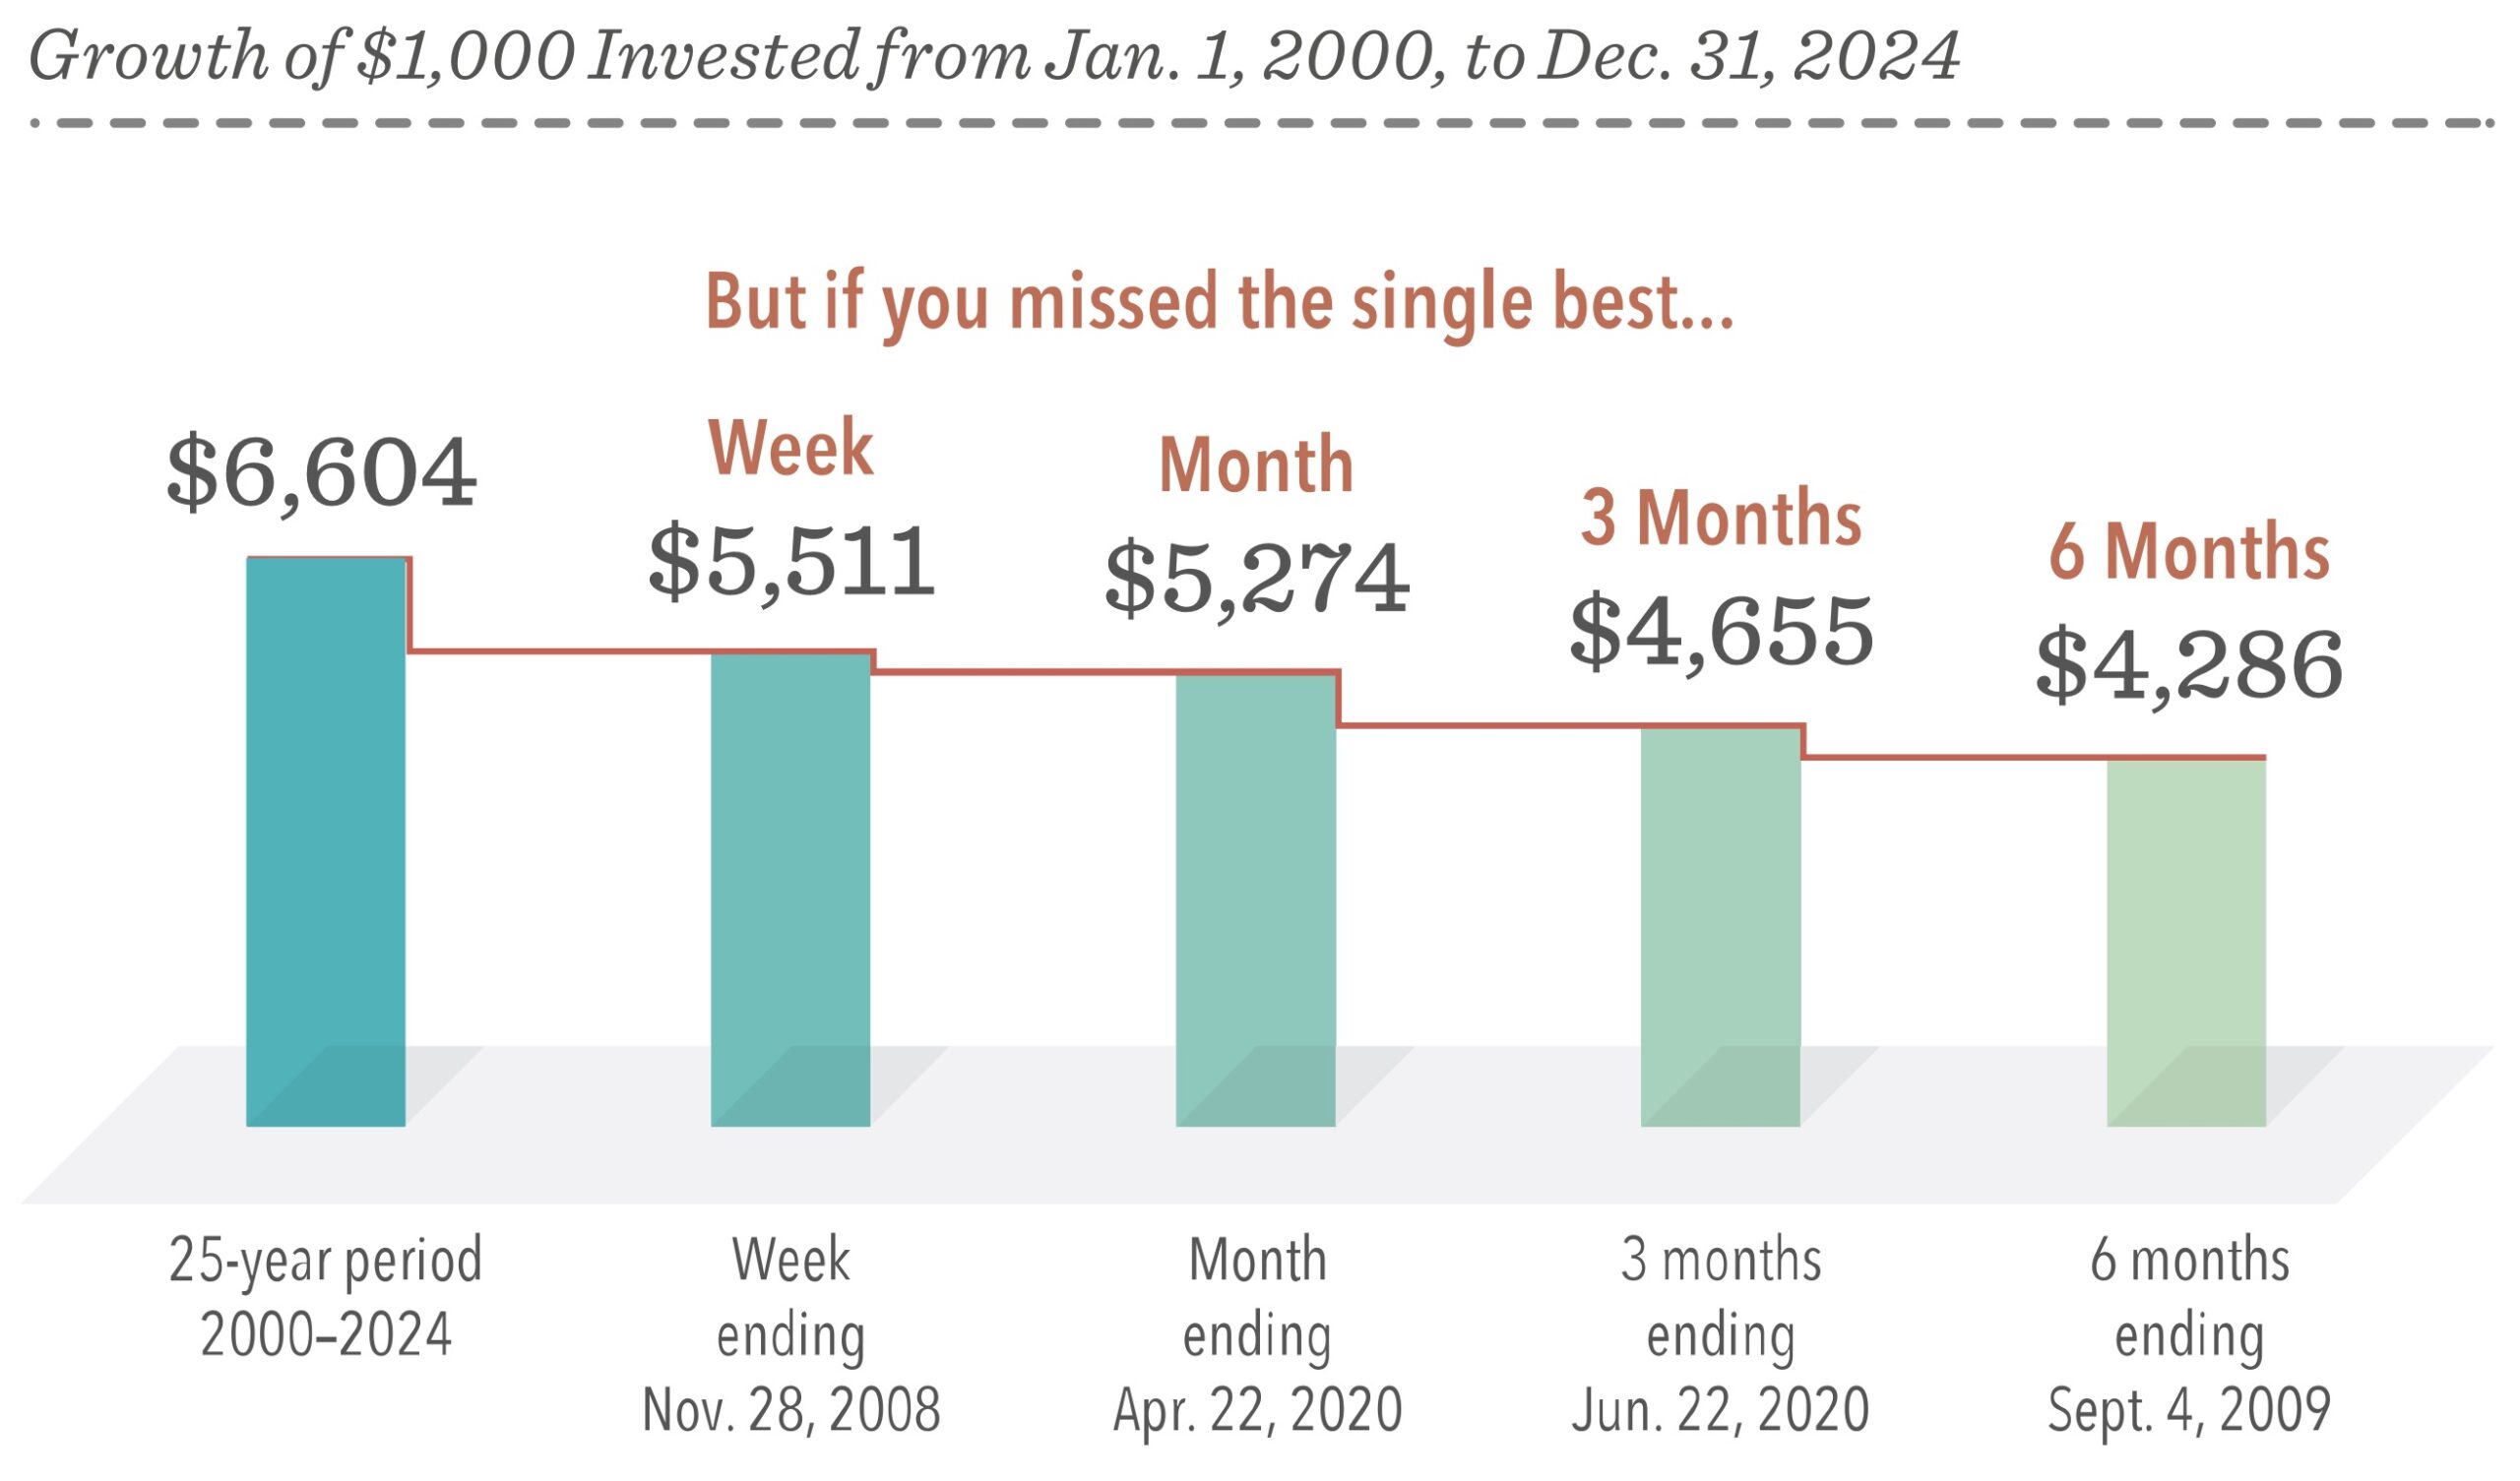
In USD, For illustrative purposes. Best performance dates represent end of period (November 28, 2008, for best week; April 22, 2020, for best month June 22, 2020, for best three months, and September 4, 2009, for best six months). The missed best consecutive days examples assume that the hypothetical portfolio fully divested its holdings at the end of the day before the missed best consecutive days, held cash for the missed best consecutive days, and reinvested the entire portfolio in the Russell 3000 Index at the end of the missed best consecutive days. Data presented in the Growth of $1,000 exhibit is hypothetical and assumes reinvestment of income and no transaction costs or taxes. The data is for illustrative purposes only and is not indicative of any investment.
When markets go up and down, many people struggle to separate their emotions from investing. Reacting to current market conditions may lead to making poor investment decisions.
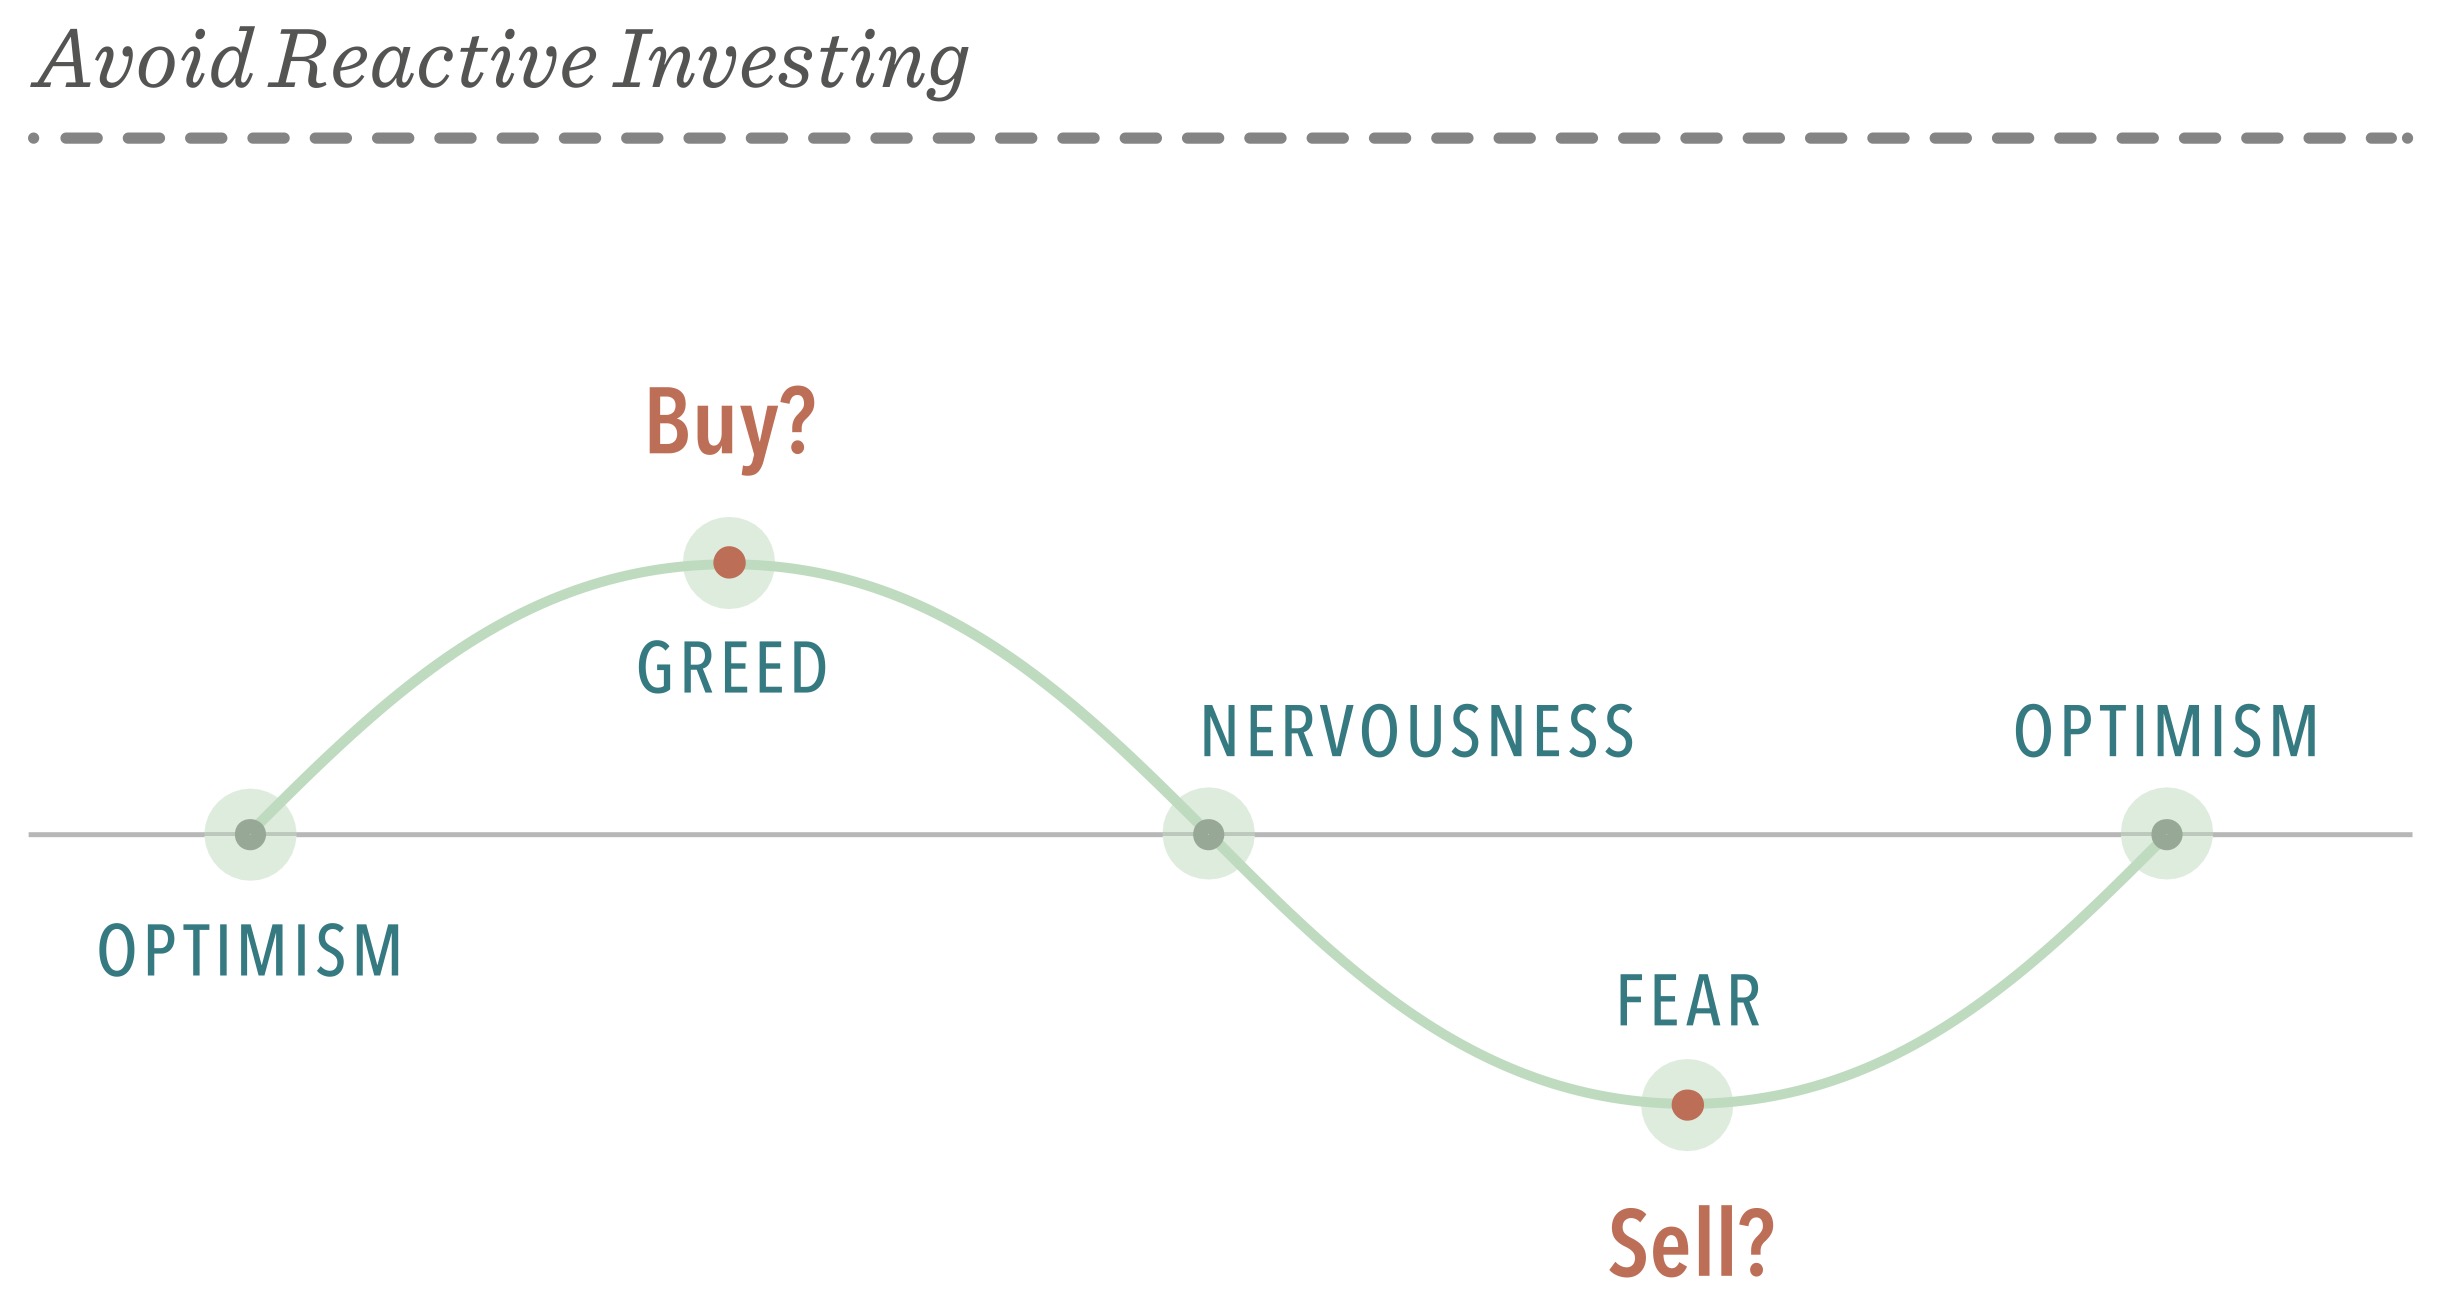
Daily market news and commentary can challenge your investment discipline. Some messages stir anxiety about the future, while others tempt you to chase the latest investment fad. When headlines unsettle you, consider the source is it news or entertainment? Do yourself a favor and tune out the noise.

Work with your financial advisor to stay focused on actions that add value. While you can’t control which way the market will turn, following time-tested principles can lead to a better investment experience.
Diversification does not eliminate the risk of market loss. There is no guarantee investment strategies will be successful. This information is for illustrative purposes only.
Bloomberg data provided by Bloomberg. MSCI data MSCI 2025, all rights reserved. Frank Russell Company is the source and owner of the trademarks, service marks, and copyrights related to the Russell Indexes. FTSE fixed income indices © 2025 FISE Fixed Income LLC. All rights reserved. S&P data 2025 S&P Dow Jones Indices LLC, a division of S&P Global. All rights reserved. CRSP data is provided by the Center for Research in Security Prices, University of Chicago. Treasury bills data provided by Ibbotson Associates via Morningstar Direct. US Consumer Price Index data is provided by the US Department of Labor Bureau of Labor Statistics.
Dimensional Fund Advisors LP is an investment advisor registered with the Securities and Exchange Commission.
Consider the investment objectives, risks, and charges and expenses of the Dimensional funds carefully before investing. For this and other information about the Dimensional funds, please read the prospectus carefully before investing. Prospectuses are available by calling Dimensional Fund Advisors collect at (512) 306-7400 or at dimensional.com. Dimensional funds are distributed by DFA Securities LLC.
Mutual fund investment values will fluctuate, and shares, when redeemed, may be worth more or less than original cost Diversification neither assures a profit nor guarantees against a loss in a dedining market. There is no guarantee investment strategies will be successful.
EIF’s trade like stocks, fluctuate in market value, and may trade either at a premium or a discount to their net asset value. ETF shares trade at market price and are not individually redeemable with the issuing fund, other than in large share amounts called creation units. ETFs are subject to risks similar to those of stocks, including those regarding short-selling and margin account maintenance. Brokerage commissions and expenses will reduce returns.
Investment products:
Dimensional Fund Advisors does not have any bank affiliates.
This information is not meant to constitute investment advice, a recommendation of any securities product or investment strategy (including account type), or an offer of any services or products for sale, nor is it intended to provide a sufficient basis on which to make an investment decision. Investors should consult with a financial professional regarding their individual circumstances before making investment decisions.
The Risk of “Safe Assets” is that you might end up running in place
How many millionaires do you know that have become wealthy by investing in savings accounts?
I rest my case.
Sources:Bankrate.com, U.S. Treasury, and Standard & Poor’s. Rates of return and inflation are derived using the averages from 1995 to 2016. U.S. equities are represented by the S&P 500 Index. Past performance does not guarantee future results.
When deciding to claim Social Security benefits, it is important to carefully evaluate several trade-offs that can influence your financial future. Understanding these factors will help you make an informed decision that aligns with your long-term needs.
As you approach retirement, it’s important to evaluate several financial planning checkpoints to ensure a smooth transition and long-term security. Consider the following areas as you prepare for this next phase:
The Risk of “Safe Assets” is that you might end up running in place
How many millionaires do you know that have become wealthy by investing in savings accounts?
I rest my case.
Sources:Bankrate.com, U.S. Treasury, and Standard & Poor’s. Rates of return and inflation are derived using the averages from 1995 to 2016. U.S. equities are represented by the S&P 500 Index. Past performance does not guarantee future results.
Risk profiling is a process for finding the optimal level of investment risk for your client by balancing their risk required, risk capacity and their individual risk tolerance.

Risk Required is the risk associated with the return required to achieve the client’s goals from the financial resources available.
Risk Capacity is the level of financial risk the client can afford to take.
Risk Tolerance is the level of financial risk the client is emotionally comfortable with.
Business succession planning is an essential process for ensuring the successful transition of a company or its interests to the next generation or designated successors. The main objectives of this planning process help maintain stability, financial security, and minimize potential disruptions associated with leadership or ownership changes.
Long-term care is not limited to nursing homes. Many people will require long-term care at some point, often starting with home care and possibly transitioning to assisted living or eventually care in a nursing home.
To better understand your Goals, Needs, and Vision for your desired Asset Transfer Plan.
Asset transfers plans usually need to established with the assistance of an attorney to create:
It can be very difficult for investors to be objective and unemotional when it comes to their money.
For that reason, we believe one of the best ways to determine your risk tolerance is to:

It may be useful to match dependable income sources with fixed retirement expenses while coordinating other investments with more discretionary expenses.

A Power of Attorney Plan provides several important benefits for individuals seeking to ensure their wishes are respected and their interests protected. The following sections will help you better understand the purpose and advantages of establishing such a plan.
Power of Attorney designations generally need to be established with the assistance of an attorney to create the appropriate legal documents. These may include:
A Beneficiary Review provides the opportunity to confirm who may inherit your legacy. Taking time to periodically review your beneficiary designations ensures that your wishes are honored and that your legacy is passed on as you intend, potentially spanning over a lifetime.
It is important to review any account or insurance policy that designates a beneficiary. These may include, but are not limited to:
Life insurance serves different purposes throughout various stages of your life. Your need for coverage depends on your individual needs, desires, and circumstances. For example, in your early years, life insurance can provide financial protection for your loved ones should the unexpected occur. As you transition through major life events—such as marriage, starting a family, or purchasing a home—your insurance needs may change to reflect new responsibilities. In your later years, life insurance may help with legacy planning and ensuring financial security for your heirs. By evaluating your current situation and future goals, you can determine the right level of life insurance coverage for each stage of your life.
Many employers offer life insurance as part of their benefits package, but this coverage may not be sufficient to fully protect your loved ones or meet your long-term financial goals. Considering an individual life insurance policy in addition to your employer-provided coverage can offer extra security and flexibility, ensuring your needs are met at every stage of life.
Offices conveniently located in Lombard and Naperville, Illinois.
| Office: | 630-796-6161 |
| Facsimile: | 630-796-6162 |
| Lombard: | 555 E Butterfield Rd., Suite 212 Lombard, IL, 60148 |
| Naperville: By appointment only | 1700 Park St., Suite 203 Naperville, IL 60563 |
Securities offered through Cambridge Investment Research, Inc., a Broker/Dealer, Member FINRA/SIPC to residents of AK, AZ, CA, CO, DC, FL, GA, HI, KS, IA, IL, IN, LA, MA, MI, MN, MO, NC, NJ, NM, NV, NY, OK, OR, SC, SD, TN, TX, VA, WA, WI. Advisory services offered through Cambridge Investment Research Advisors, Inc., a Registered Investment Advisor. Cambridge and Independence Capital Financial Partners, LLC are not affiliated. Cambridge does not offer tax or legal advice.
© Copyright 2026 Independence Capital Financial Partners, LLC
Loading...
Now that you have built a legacy, it’s important to think about how to distribute that legacy to the next generation. Thinking ahead can make the difference when it comes to passing down not just assets, but values, to later generations and causes.

Building financial health is not only about acquiring wealth, it’s also about protecting wealth.

Things to think about:
“Good habits, which bring our lower passions and appetites under automatic control, leave our natures free to explore the larger experiences of life. Too many of us divide and dissipate our energies in debating actions which should be taken for granted.” —Ralph W. Sockman
Wealth is not just financial. It is not only found in bank vaults or investment accounts nor can it be measured in the number of homes or material items possessed. It may sound cliché but for most people it is the quality of family relationships, the human assets that really matter.

The human assets are the people in our lives. Human assets are also the values and principles that guide our lives and made us who we are today.
They are the unique stories and collective life experiences that formed across generations. Human assets include the skills our family members possess and our family’s collective interpretations of what constitutes happy and fulfilling lives. It is the governance framework used to make decisions that affect the entire family.
Families should set aside money for investment as early and as often as possible.
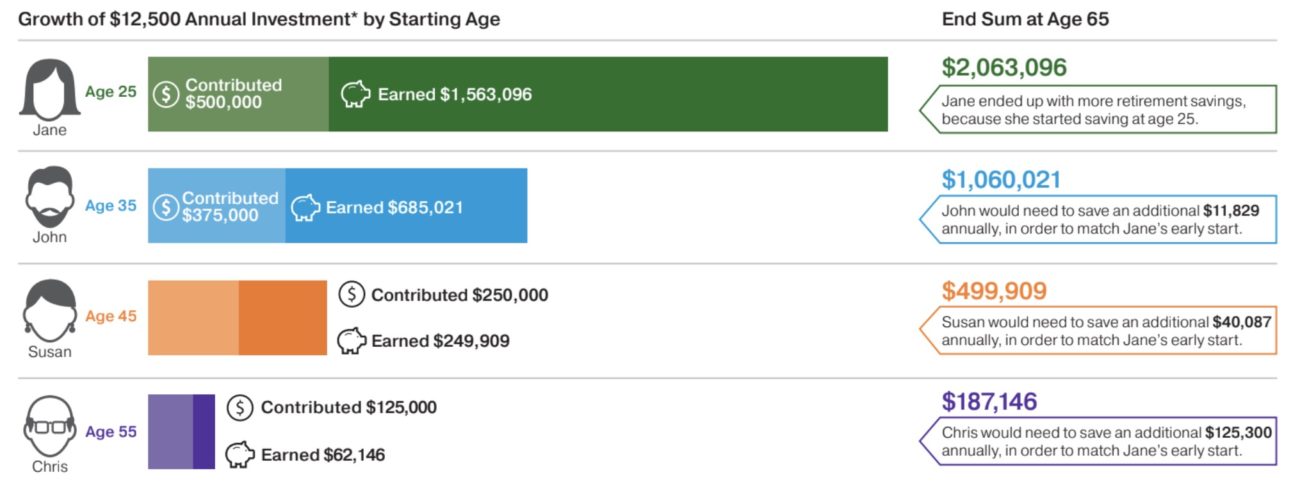
In the above example, we highlight a 25-year old who is investing $12,500 per year in hypothetical investments returning 6% per year. By age 65, our 25-year old will have contributed $500,000 into her investment account but will have earned $1,563,096 in investment returns for an end sum of $2,063,096.
But what if she started later in life? Not only will her total contributions be smaller but her earned returns will be smaller as well. In fact, if she doesn’t start until she is 45 years old then she would have to invest an additional $40,087 per year to catch up to her 25-year-old self.
In short, start young and invest often.